Scatter graphs and correlation
Chapters
- 0:00Introduction
- 0:22Do Now
- 1:02Plotting a scatter graph
- 1:43Correlation
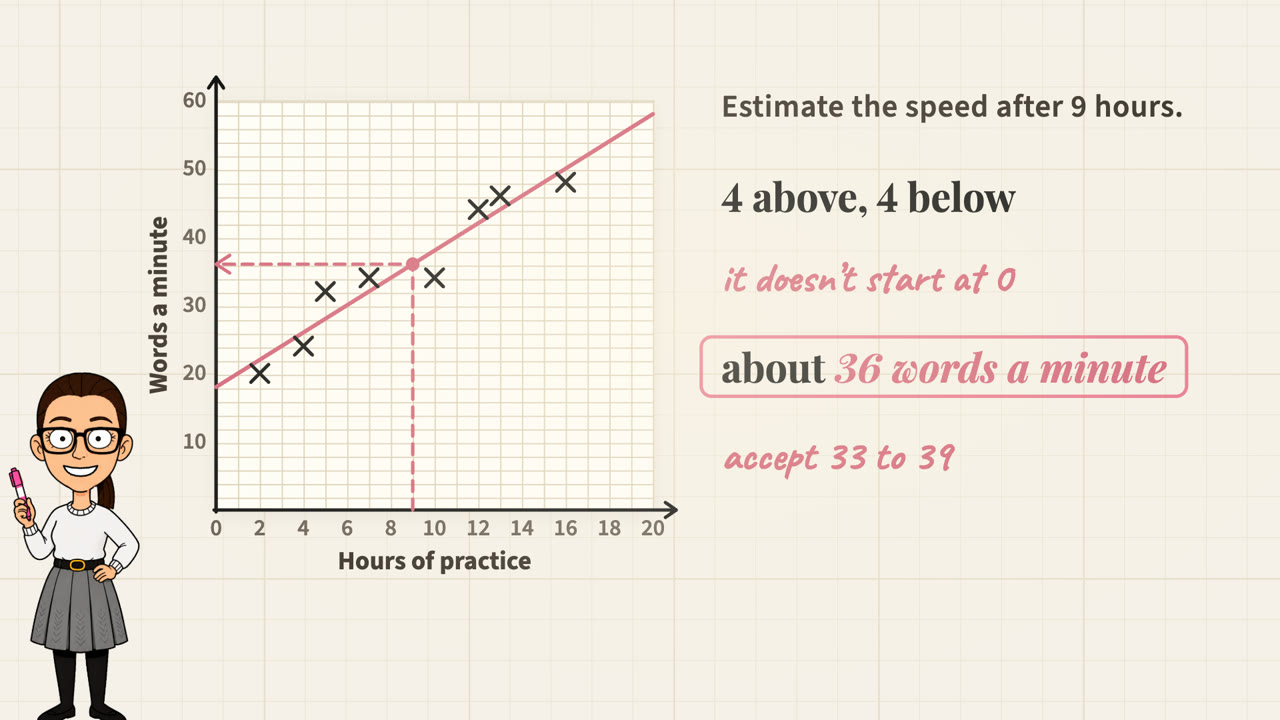
- 2:17Example 1: a line of best fit
- 2:52Example 2: an outlier
- 3:37Your turn
- 4:22Common mistake
- 4:47Worksheet and exit question
Practise representing data for 15 minutes a day in The Maths Habit, on your phone or in your browser.